Exploring Google Search Console’s Bubble Chart: A Visual SEO Analysis
In the vast realm of digital marketing and search engine optimization (SEO), understanding the performance of your website on search engines like Google is crucial. Google Search Console (formerly known as Google Webmaster Tools) is a powerful tool that provides webmasters and SEO professionals with invaluable insights into their website’s performance in Google search results. Among its numerous features, the Bubble Chart is a visually engaging and informative tool that deserves a closer look.
What is Google Search Console?
Before diving into the specifics of the Bubble Chart, let’s briefly introduce Google Search Console. It’s a free web service offered by Google to help website owners monitor and optimize their site’s visibility in Google search results. By connecting your website to Google Search Console, you gain access to a wealth of data about how your site is performing in search.
This includes information about which keywords are driving traffic to your site, how often your site appears in search results, and the click-through rates for those results. It also provides insights into potential issues with your site that could affect its performance in search, such as crawl errors, mobile usability problems, and security issues.
The Visual Appeal of the Bubble Chart
Among the various tools and reports in Google Search Console, the Bubble Chart stands out due to its visually appealing and intuitive design. It provides a graphical representation of your website’s search performance, making it easier to spot trends and anomalies at a glance.
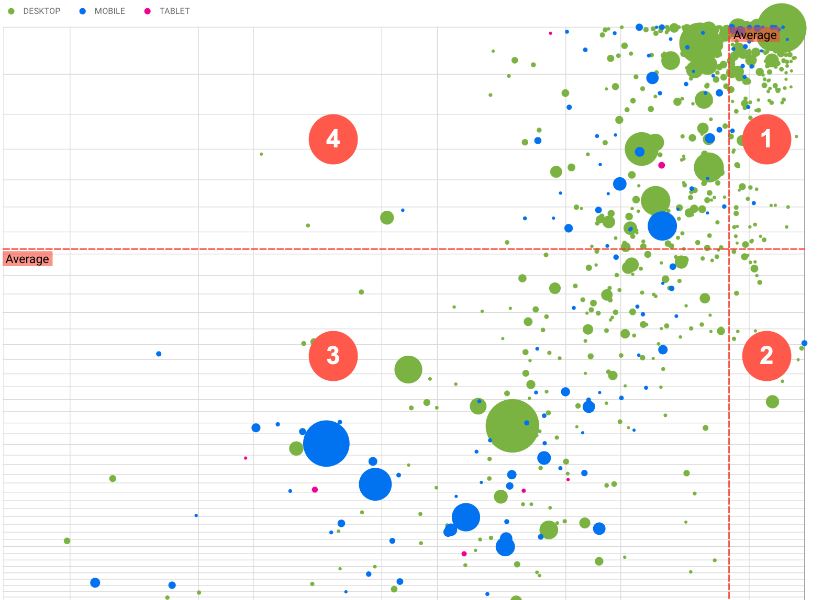
Google Search Console Bubble Chart
In the Bubble Chart, each bubble represents a specific web page from your site. The size of the bubble corresponds to the page’s total number of clicks, and the position of the bubble on the chart indicates its average position in search results. Bubbles are color-coded to represent different website categories, making it easy to identify the performance of specific sections of your site.
Key Insights from the Bubble Chart
Now, let’s delve into the valuable insights you can gain from the Bubble Chart in Google Search Console:
1. Identifying Top Performers
The larger bubbles on the chart represent pages that are driving the most traffic to your site. By quickly identifying these top performers, you can focus your efforts on optimizing and enhancing their content and user experience. This can help you leverage your strengths and maintain or improve your high-ranking positions.
2. Discovering Opportunities
On the flip side, the smaller bubbles may indicate pages with untapped potential. These pages may be ranking well but not receiving as much traffic as they could. Investigate these pages to uncover opportunities for improvement, whether it’s through keyword optimization, content enhancements, or better internal linking.
3. Tracking Changes Over Time
One of the most valuable aspects of the Bubble Chart is its ability to show how your site’s performance evolves over time. You can use the date range selector to compare different time periods and observe shifts in your website’s search visibility. Sudden changes in bubble positions or sizes can alert you to issues or successes that may require further investigation.
4. Category Performance
The color-coding of bubbles allows you to analyze the performance of different sections or categories of your website. For example, you can see how well your blog posts are doing compared to your product pages. This insight can help you allocate resources more effectively and make informed decisions about where to focus your SEO efforts.
5. Click-Through Rates (CTR)
While bubble size represents the number of clicks, you can also glean insights into click-through rates by examining how far to the right or left the bubbles are positioned on the chart. Bubbles on the right side, closer to the center, tend to have higher click-through rates, indicating that users are more likely to click on those search results.
Photo by Google
Putting Insights into Action
Understanding the insights provided by the Bubble Chart is just the first step. To make the most of this data, you need to take action:
1. Content Optimization
Identify your top-performing pages and ensure they offer valuable, up-to-date, and engaging content. Optimize meta titles and descriptions to encourage higher click-through rates for these pages.
2. Keyword Research
For pages that are not performing as expected, conduct keyword research to identify relevant keywords and phrases that could boost their visibility. Update the content and metadata accordingly.
3. Mobile Optimization
As mobile search becomes increasingly important, pay attention to how your pages perform on mobile devices. Use the Mobile Usability report in Google Search Console to address any issues.
4. Technical SEO
Keep an eye on any crawl errors or security issues that Google Search Console alerts you to. These issues can negatively impact your search rankings, so addressing them promptly is essential.
5. Regular Monitoring
Use the Bubble Chart to regularly monitor changes in your website’s search performance. Are your optimizations yielding positive results? Are there new opportunities or threats on the horizon? Stay vigilant and adjust your SEO strategy accordingly.
Google Search Console’s Bubble Chart is a valuable tool for SEO professionals and website owners.
Its visually engaging representation of search performance data can provide quick insights into your website’s strengths and weaknesses in search results. By using this tool effectively and taking action based on its insights, you can improve your website’s search visibility and drive more organic traffic, ultimately helping your online presence thrive in the competitive digital landscape. Our Digital Marketing Company is always open to take calls on how we can help improve your business with our SEO tools and knowledge. Get in contact with us today!